Posted on by Admin
Subscribe to our Telegram channel for the latest updates in the marketing and advertising scene
Astro ups the game on OTT among Malaysian integrated media players
15 Apr
To be fair to the uninitiated, OTT (Over The Top) refers to content
provided via internet connection. With the Movement Control Order (MCO) in
place, more viewers are choosing OTT as their preferred choice of consuming
long form content.
OTT has had
the biggest impact in the Video on Demand (VOD) space. A PwC’s report in May
2018 said OTT VOD revenue is projected to increase by 80% to 90% between 2016
to 2021 in Southeast Asia. PWC estimated that Asia Pacific will overtake North
America as the world’s biggest region in OTT revenue in 2021.
Increasingly the empowered consumers want to exert greater control over
how and where they consume the media. Consumers are looking for avenues to
enjoy media experiences that uniquely tailored to their own personal
preferences and context.
During the MCO, Malaysian integrated media players have seen an increase in download of their app services, with Astro GO taking the lead at 70% growth or a total of 265K new users in the first 18 days of MCO. Correspondingly, Dimsum, Tonton and PlayTv has also shown double digit increase in downloads during this period.
In Daily Active Users (DAU): Astro GO and Tonton have both garnered stronger DAU growth rate of 30% and 6% respectively. In Astro GO’s case, it achieved 1.2mil in total daily active users during MCO period.
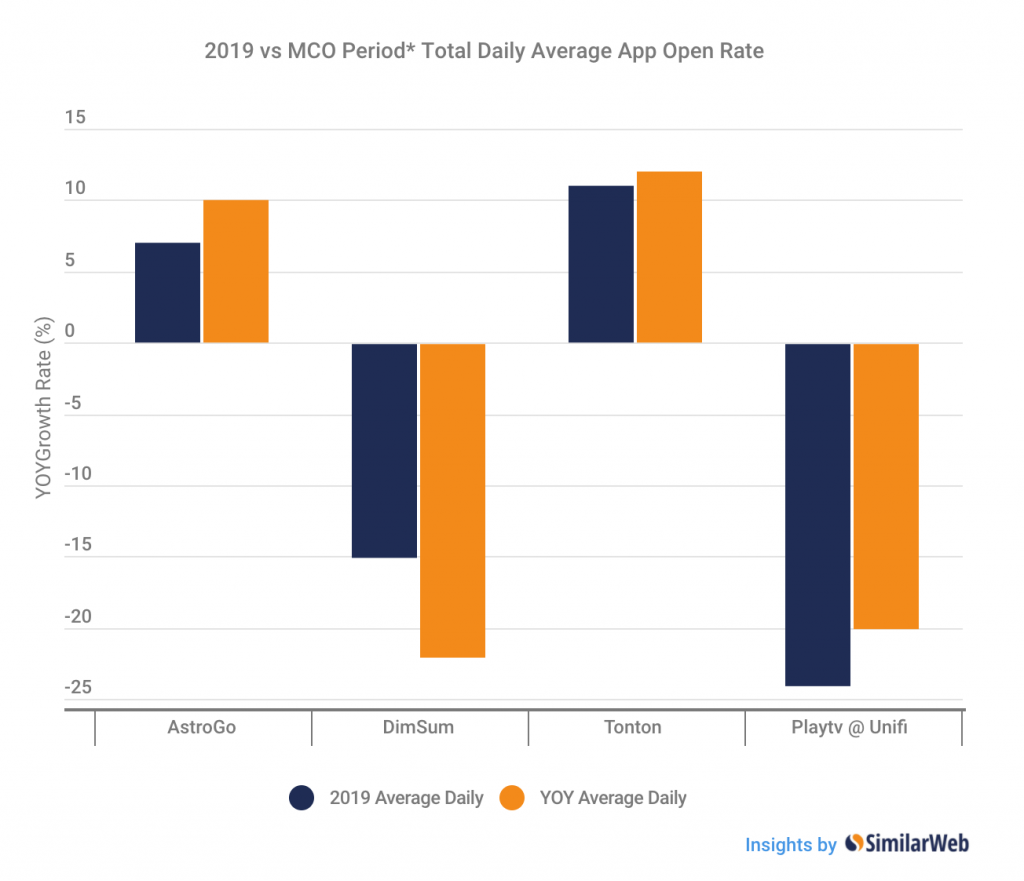
Relatively, App Open Rate has a similar pattern as DAU with Astro GO and Tonton on the slight increase 6-10% trend. They both maintain a rather stable open rate before and during the MCO.
As seen in the graph below, all OTT websites’ total traffic (desktop & mobile web) have shown growth led by Tonton and Astro GO. The latter has seen a spike in its website traffic by two folds compared to last year.
Overall, most local OTT providers have shown growth rate for total page views, except for Dimsum. The incremental of 35-55% has shown the indicative that viewers are consuming more content on their device during MCO.
*MCO Period: 18 March 2020 – 4 Apr 2020
2019 Average Daily: Total 2019 Average Daily
vs 18 March – 2020 Average Daily
YOY Average Daily: 18 March – 4 Apr 2019 vs 18
March – 4 Apr 2020 Average Daily Count
App Download represents
the number of daily downloads of the analyzed app over a set period of time.
Daily Active User represents the number of unique users who use the analyzed app on
a daily basis, in the analyzed country and timeframe, each user needs to be
active in the app for at least 10 minutes.
Open Rate
represents the percentage of the total Android devices who have installed the
app, and use the analyzed app on a daily basis, in the analyzed country and
timeframe.
All data quoted above are provided by *SimilarWeb.
*About SimilarWeb:
As the most trusted platform for measuring online
behavior, millions of people rely on SimilarWeb insights daily as the ground
truth for their knowledge of the digital world. We empower anyone — from the
curious individual to the enterprise business leader — to make smarter
decisions by understanding why things happen across the digital ecosystem.
We use cookies to ensure that we give you the best experience on our website. If you continue to use this site we will assume that you are happy with it.OkNoPrivacy Policy