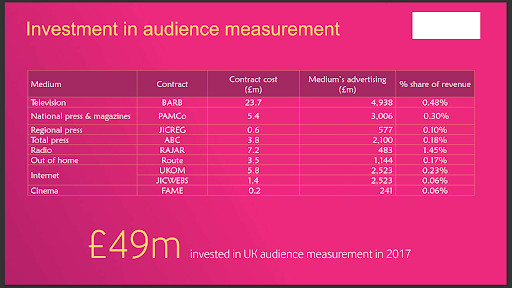
The first part was published here where it discussed funding related issues and high-level strategic directions and opportunities. Below is a highly relevant slide from the UK, highlighting measurement cost benchmarks for various medium in 2017.
While it sounds dated and five years old, the industry practitioners will be fully aware that these ratios will not move too far, too fast.

As the traditional, linear-TV advertising continues to decline and with corresponding increase in Digital Video Advertising, it is imperative that the industry need to ensure active participation and a fair contribution from the Global Digital Platforms (Google, Meta, TikTok, Amazon (as and when they enter Malaysia) etc), OTT-centric players like iQiYi, Disney+Hotstar, Viu etc and not just continue to squeeze the Malaysian-based content producers and broadcasters.
Depending on MCMC for investments from taxpayers’ hard earned money is unjust, unfair and will not help, unless MAA-led industry rallies the ecosystem to form a JIC-body to drive these sensitive investment commitments and vendor negotiations.
Technical building blocks:
All fundamental and basic discussions around audience measurement starts with the Sample Size. As we study the Malaysian requirement, let us look at few other countries:
| Country | Yr.2020
Population (Mn) |
Yr.2020
Household (Mn) |
Yr.2020
Avg. HH Size |
TV Audience Measurement Panel Size |
| Brazil | 212.6 | 72.4 | 2.9 | 6,060 |
| Germany | 83.2 | 40.1 | 2.1 | 5,400 |
| Malaysia_Nielsen | 32.4 | 7.8 | 4.2 | 1,100 (Pen. Mal)
150* (East Mal.; To be Live in 2023) |
| Netherlands | 17.4 | 8.0 | 2.2 | 1,250
3,500 Individual |
| France | 67.4 | 30.3 | 2.2 | 5.000
4,500 Individual |
| India | 1,380.0 | 248.8 | 5.5 | 44,000 |
| Japan | 125.8 | 53.5 | 2.4 | 9,700 |
| UK | 67.2 | 27.8 | 2.4 | 5,350 |
| US | 329.5 | 128.5 | 2.6 | 40,000 |
| Canada | 38.0 | 10.3 | 3.7 | 4,500 |
| Denmark | 5.8 | 2.7 | 2.2 | 1,200 |
| Sweden | 10.4 | 6.0 | 1.7 | 3,000 |
| Italy | 59.6 | 26.2 | 2.3 | 16,000 |
| Finland | 5.5 | 1.5 | 3.8 | 1,000 |
| Ireland | 5.0 | 1.6 | 3.1 | 1,111 |
| Singapore | 5.7 | 1.4 | 4.2 | 1,200 |
| Norway | 5.4 | 2.5 | 2.1 | 2,500 |
| Malaysia_Pay-TV | 2.5
(Estimate) |
4.2 | 2,500
(Estimate) |
|
| Australia | 25.7 | 9.8 | 2.6 | 5,250 (Metro) +
3,200 (Regional) + 2,120 (Met+Reg.) |
Source: Industry and Association Reports
Non-English-speaking countries with smaller HH-size tend to have much higher sample-size relative to their total population.
While the Anglo-saxon, English-speaking markets like US, UK, Canada, Ireland, Australia have a much larger spread of sample-size ratios.
Given Malaysia’s multi-dimensional complexity, getting the Sample-size, a high percentage of In-tab Homes (defined as % of Sample HHs that send their data daily), monthly updates to the UE (Universe Estimates) are extremely important to the quality of the audience measurement service.
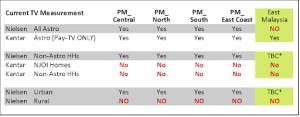
Between Kantar’s sample of 2,500+ Homes for Astro Pay-TV and Nielsen’s 1,250 Homes (including East Malaysia, which will go LIVE soon), the industry has a cumulative, gross base of 3,750 Homes, which can be grown to approx. 5,000 Homes, within the same or lesser cost-structure through better design, independent 3rd-party oversight and an involved management.
Another important aspect is the dispersion of this sample-size across states. It is general belief that for every 200 odd kilometers, the nature of soil, its mineral composition, the water and air quality changes.
These differences tend to get manifested in the local food, language, cultural symbols and practices. It is these differences, when captured, studied and deeply understood provide marketers a significant growth opportunity and fuel product/service innovations.
In marketing speak, the first and the biggest demographic filter is at the state-level. Two big challenges exist for the Malaysian marketers:
1.Very little to negligible data and information is available on East Malaysia. We now have a new Deputy Prime Minister from that region and hopefully that will help things change for the better.
2. Similarly, negligible data and information are available at state-level within Peninsular Malaysia.
Be it the Retail Audit, or the Household level, Consumer Purchase Behaviours (World Panel), or the media consumption patterns…, we tend to aggregate them to the Region-level and hence miss out on studying consumption gaps which lead to significant growth opportunities.
As digitization takes hold and more people consume IP-delivered content, be it text(news), audio/radio or video/TV, this census-level media-consumption dataset will become hugely important and there will be demanded to find causal and/or correlational effects with purchase behaviours.
MAA should make state-level reporting as non-negotiable and mandatory to unlock hidden growth opportunities, both on the revenue front and on the product/service innovation front.
Alongside Malaysia’s complexity in terms of ethnic-mix, language-mix, urban-rural split, dwelling-type, the standard age [x] gender matrix and the HH Income distribution, an often-misunderstood metric is the Astro Pay-TV Vs NJOI Vs Non-Astro numbers. Kantar reports only on Astro Pay-TV, while Nielsen does not split its report by Pay-TV and NJOI within the Astro universe.

As we saw in the previous week, SKY-TV in the UK, regularly share their subscription numbers at package-level with BARB, the industry JIC-body. Until the industry gets regular updates on Satellite-TV numbers by Pay-TV and Non -Pay-TV for Malaysia at state-level, getting true UE (Universe Estimates) will be a challenge.
Despite sounding repetitive, it is important to highlight that the industry can enjoy massive leverage by engaging different vendors for each of the above module, ensuring separation of services for greater accountability and transparency.

Paddy alias Padmanabhan had been working in the marketing and advertising industry for the past 25+ years. Currently he is engaged in data and audience measurement projects in Malaysia as an Independent Consultant. He was part of the Team that launched Dell Computers, mother of all performance marketing in India and spent significant time working with GroupM, across countries in the region.
MARKETING Magazine is not responsible for the content of external sites.


